2026-09-14
Building a Serverless Analytics Pipeline on AWS (and What Broke Along the Way)
Building a Serverless Analytics Pipeline on AWS (and What Broke Along the Way)
I mix electronic music as a hobby, and I upload my sets to SoundCloud. What I didn't have was any real visibility into how they perform over time — how plays evolve, whether a track picks up momentum weeks after release, or when it might make sense to publish something new. So I built a small pipeline that fetches my own SoundCloud stats every day, stores them, and puts them on a dashboard I actually check.
The other reason this project exists: I wanted a real, self-motivated problem to apply Infrastructure as Code and AWS serverless architecture to, instead of another tutorial exercise. This post walks through the architecture, the decisions behind it, and — more usefully, I think — the things that only broke once I deployed against a real AWS account, not while reading the docs beforehand.
Architecture
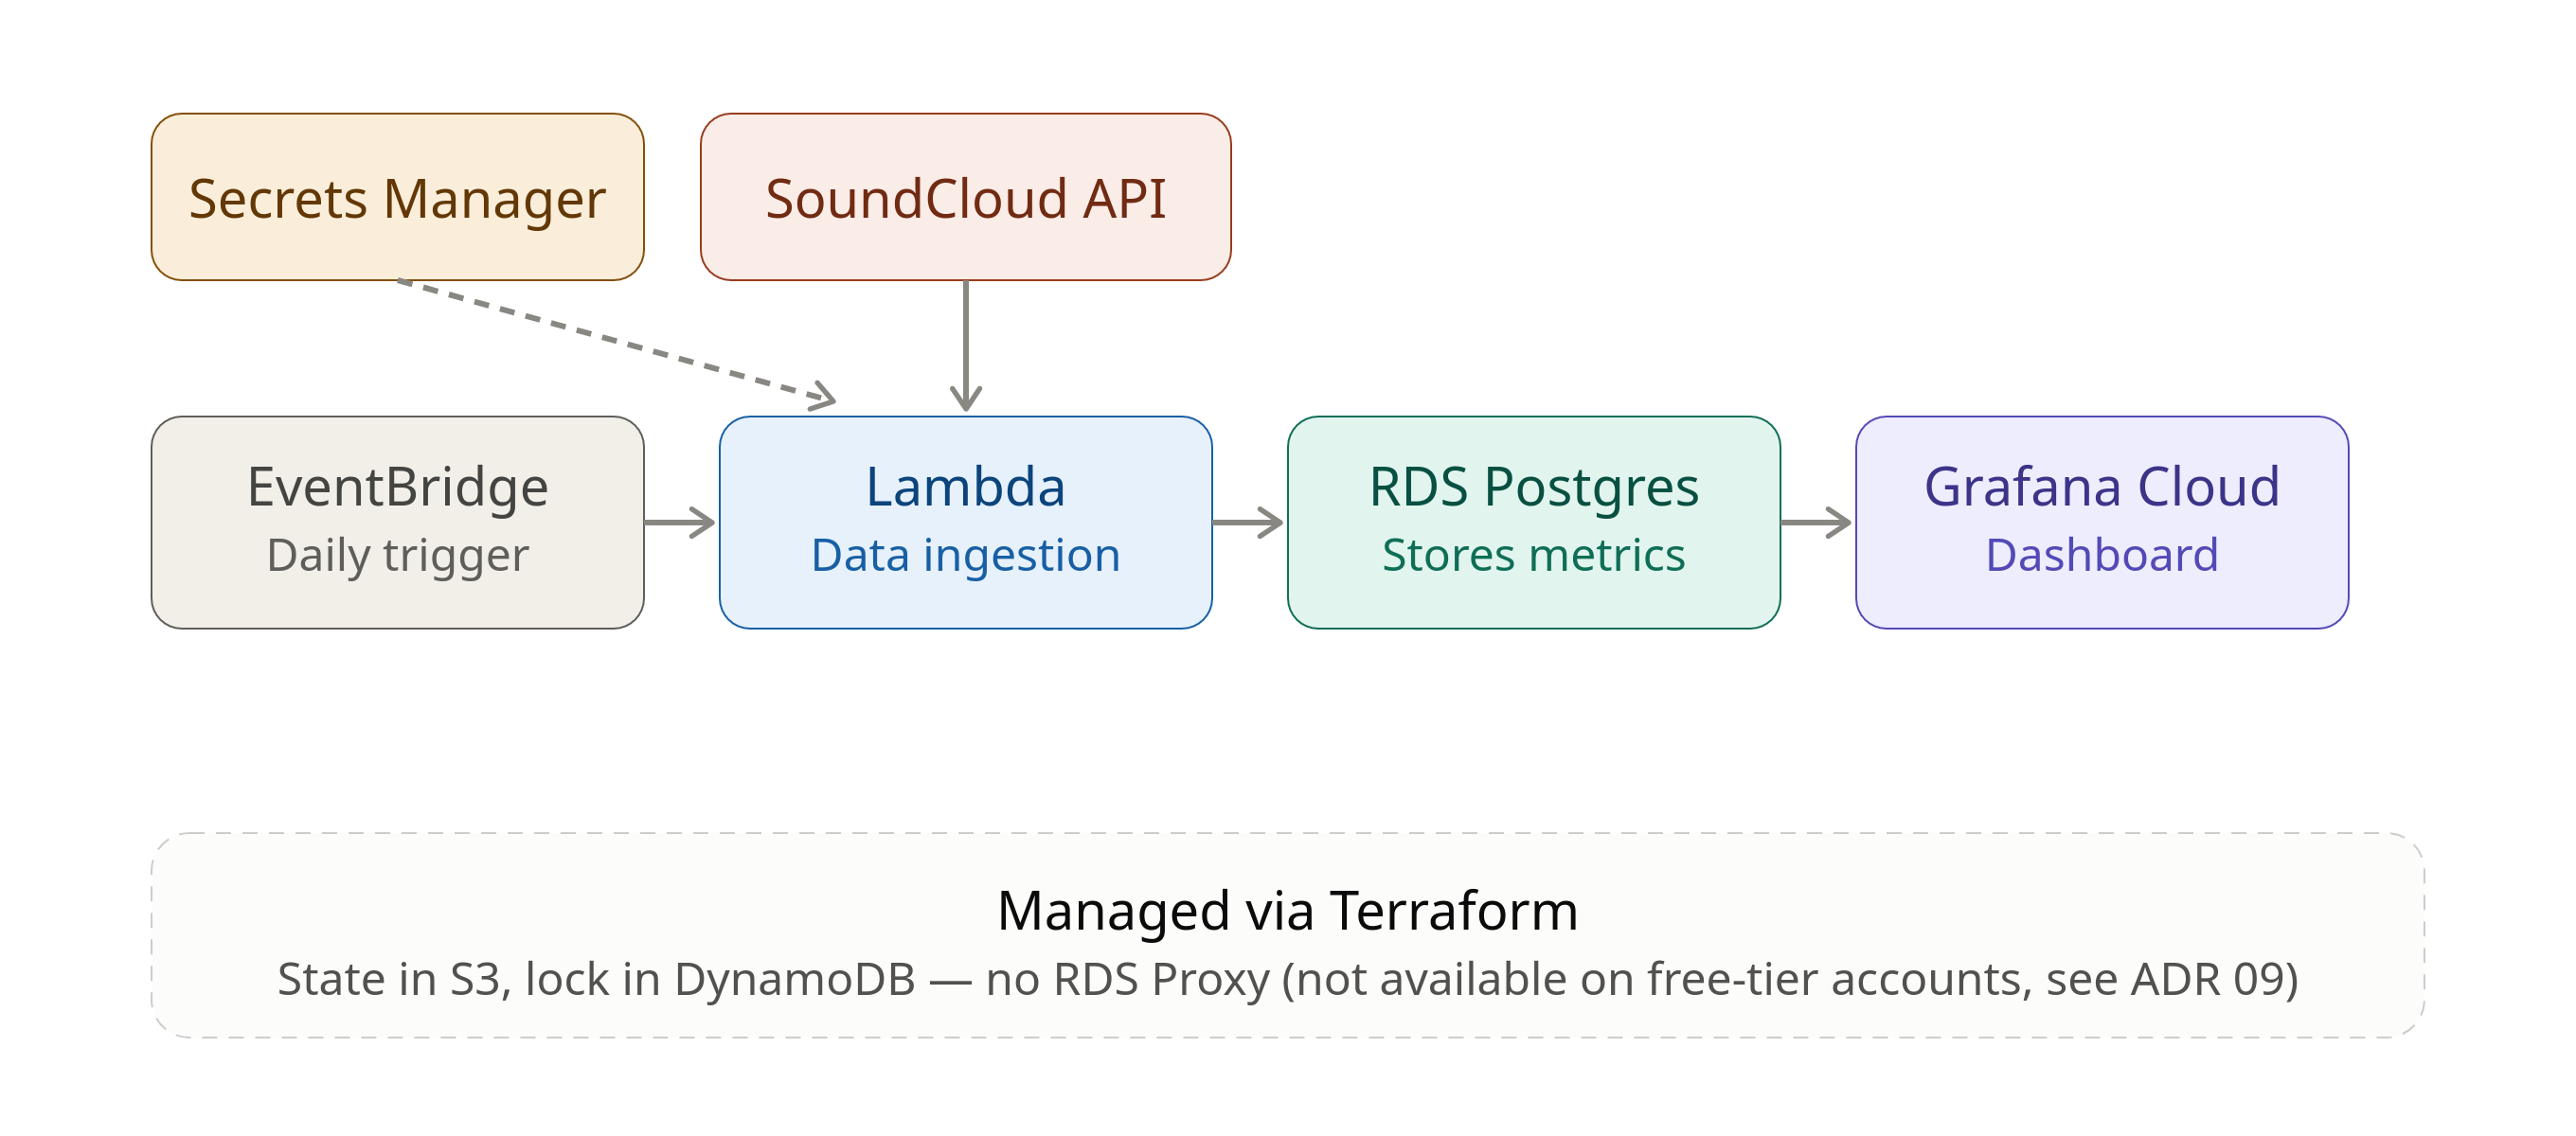
The pipeline is fully serverless:
- EventBridge triggers a Lambda function once a day (
rate(1 day)). - The Lambda authenticates against the SoundCloud API (OAuth2, refresh token flow), fetches track and account stats, and writes them to RDS Postgres.
- SoundCloud credentials live in Parameter Store; the RDS master password is auto-generated and stored in Secrets Manager — the Lambda never touches either in plaintext.
- Grafana Cloud reads from RDS through a dedicated read-only Postgres user and renders the dashboard.
- Everything is provisioned with Terraform, with remote state in S3 and locking via DynamoDB.
The project deliberately runs on-demand, not 24/7: I spin it up with terraform apply, let it collect a few days of data, take screenshots, and tear it down. For a portfolio project with no real traffic, this keeps the cost close to zero without sacrificing the architecture lessons.
Decisions worth explaining
Postgres over DynamoDB
The data is inherently relational — tracks and their daily snapshots, an account snapshot per day. I went with RDS Postgres over DynamoDB specifically because it forces you to deal with a real, well-known problem in serverless architectures: managing database connections from a function that spins up and down constantly. DynamoDB would have sidestepped that problem entirely, which is exactly why I didn't pick it.
RDS Proxy: added, then removed after a real deployment failure
This is the decision I learned the most from. I initially added RDS Proxy for connection pooling, mostly for its demonstrative value — the actual workload here is one Lambda invocation a day, nowhere near enough to need it. Here's what that version of the architecture looked like:
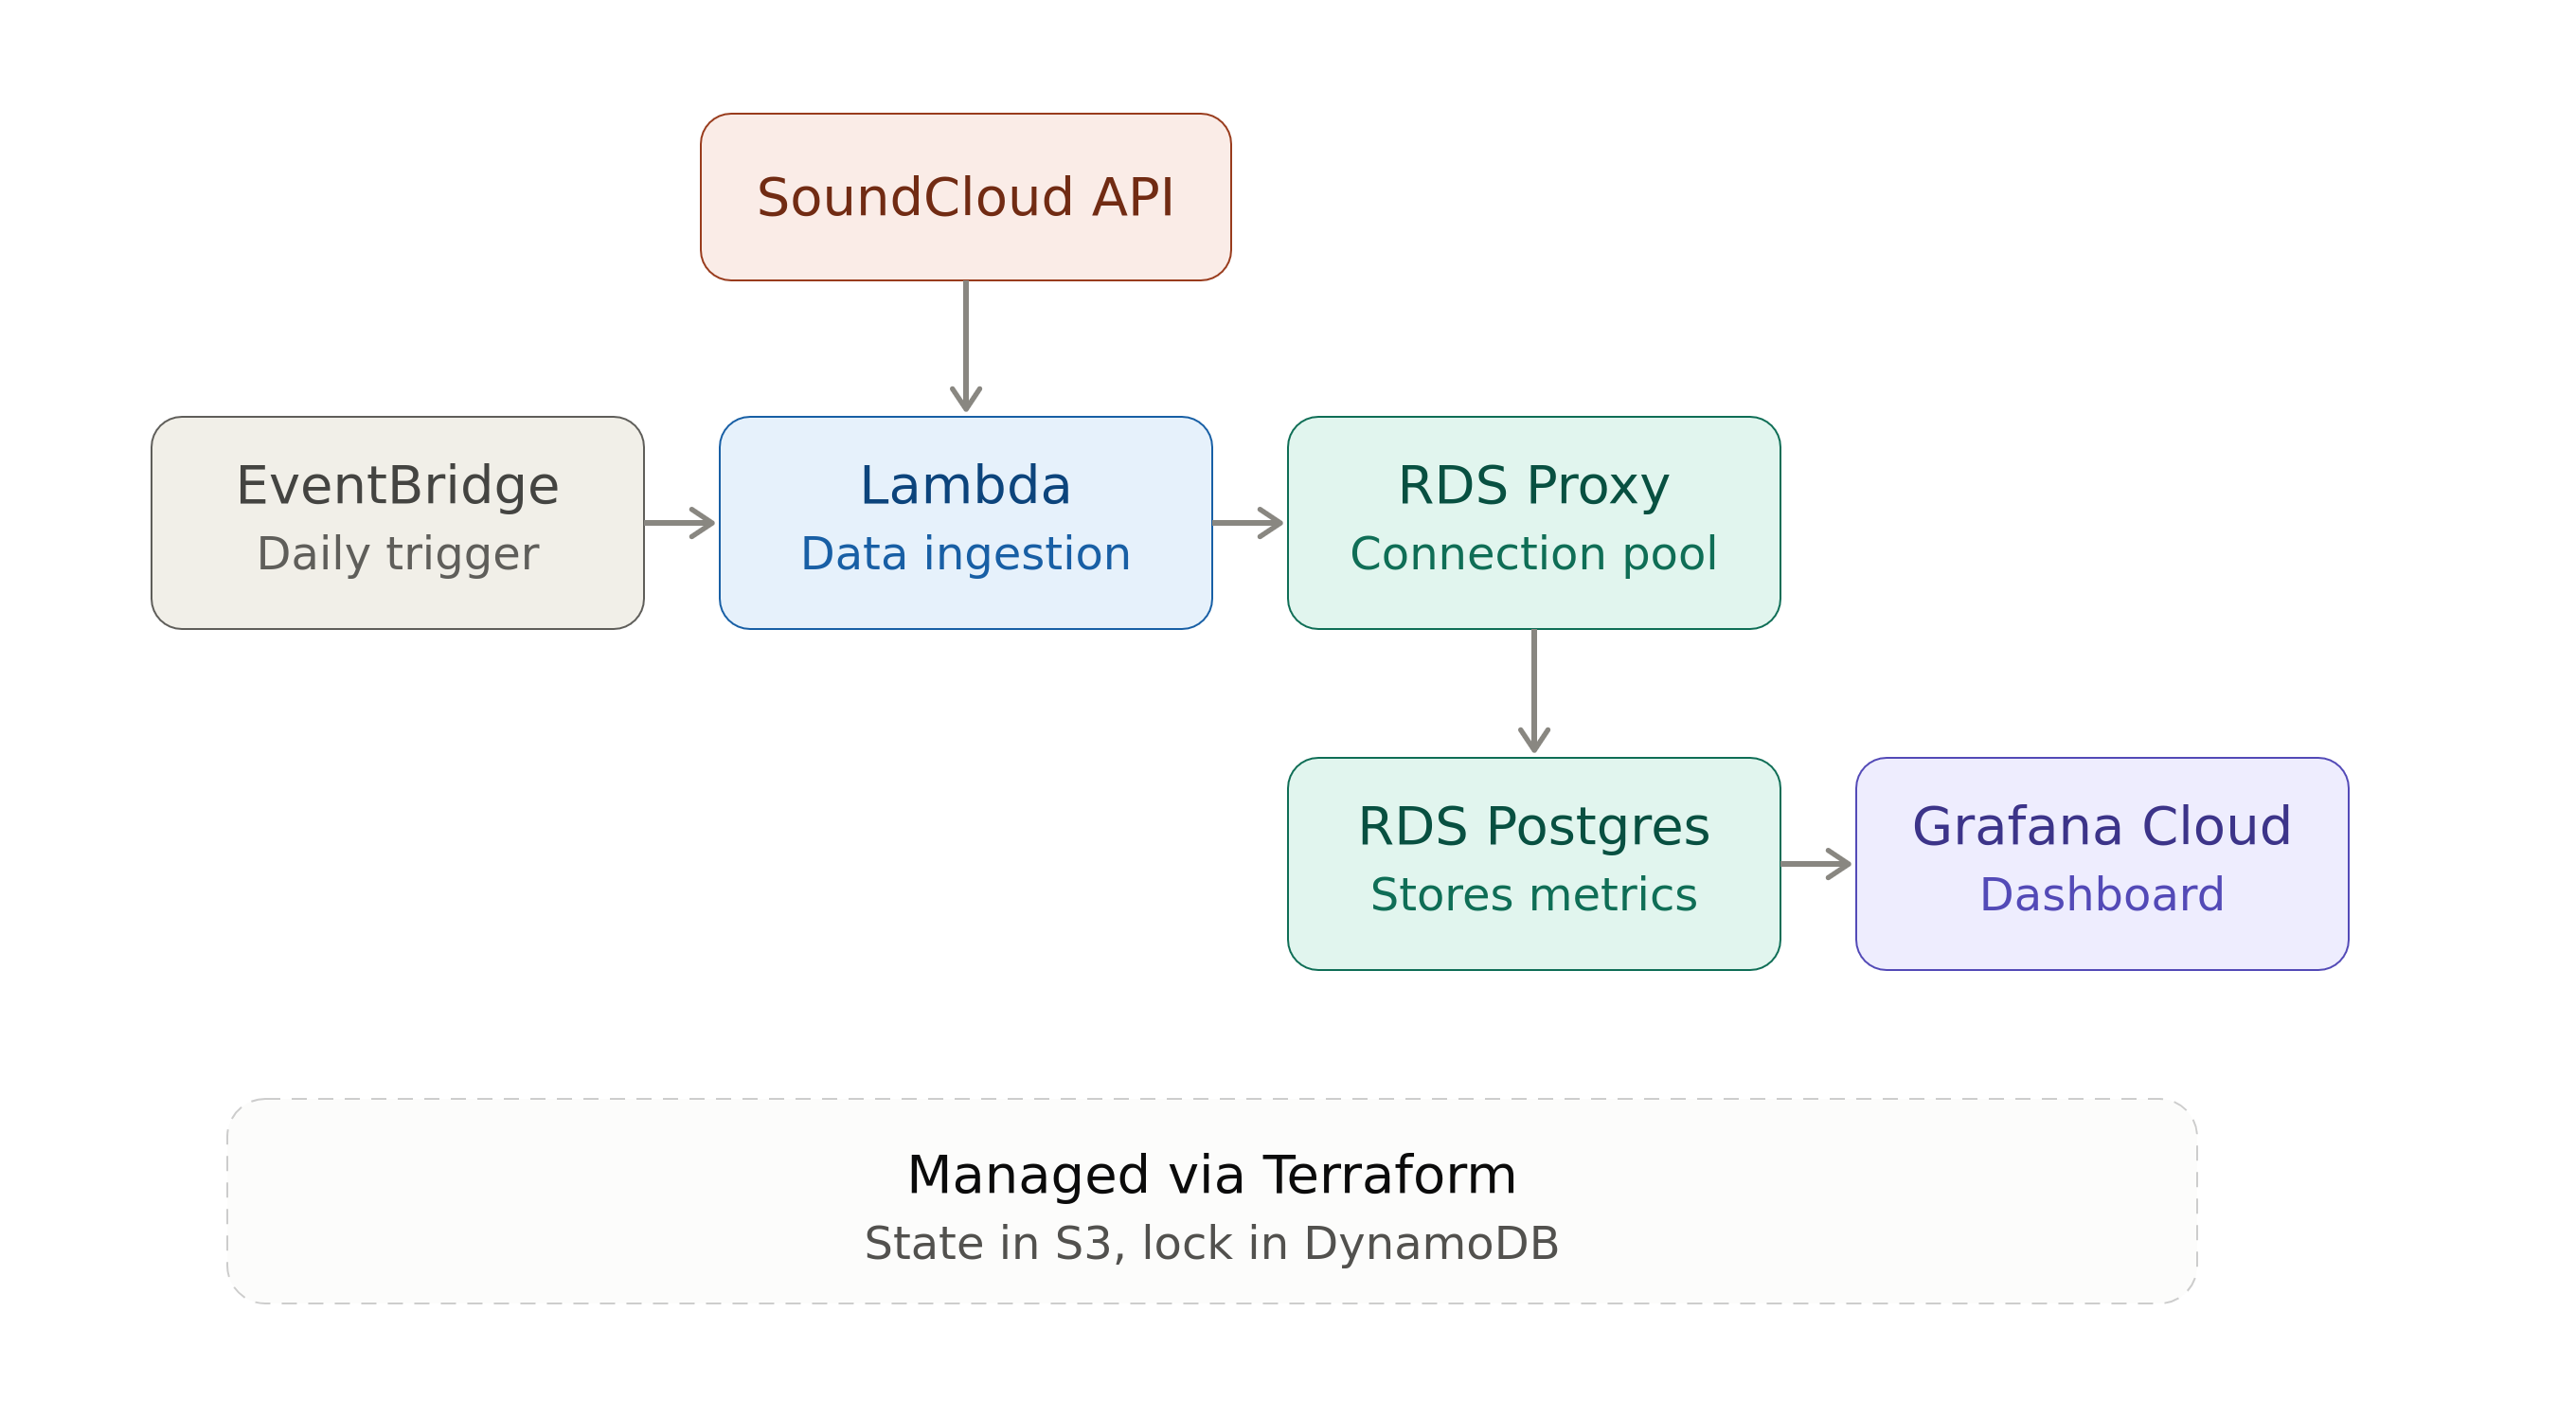
terraform plan and terraform validate both passed cleanly. Then terraform apply failed:
FreeTierRestrictionError: This feature isn't available with free plan accounts.
RDS Proxy simply isn't available on a free-tier AWS account, and there's no way to know that from plan or validate — those only check syntax and internal consistency, not account-level entitlements. I removed the Proxy entirely: the Lambda now reads the database password directly from Secrets Manager.
I think this is a more interesting story than "I used RDS Proxy" would have been. It's a small, real example of something that comes up constantly in actual infrastructure work: a decision that looks correct on paper until it meets the constraints of the environment it has to run in.
Opening RDS to the internet, on purpose
RDS has a public endpoint, restricted by Security Group — no private VPC, no NAT Gateway. A NAT Gateway has a real fixed monthly cost just for existing, which didn't make sense for a project with this on-demand deploy strategy and this level of traffic. The trade-off is explicit: RDS security here depends entirely on credentials, not network isolation. That's a fine trade-off for a portfolio project with no real user data — it wouldn't be in production with anything sensitive.
This decision had a second layer I didn't expect: once the Lambda was deployed, the first real invocation failed with a connection timeout, because Lambda functions running outside a custom VPC don't have a fixed, predictable IP. My Security Group only allowed my own IP. I ended up opening ingress to all IPs on the Postgres port, rather than adding a NAT Gateway or an Elastic IP setup just to give Lambda a stable address.
What actually broke (and how I found it)
terraform plan said everything was fine. It wasn't.
The Lambda function has a layers argument that attaches the dependencies package (requests, psycopg2-binary, etc.). I built the Layer, wrote the function, ran plan — clean. Applied — no errors. First invoke:
Unable to import module 'script': No module named 'requests'
I spent a while checking the Layer's zip contents and its version history in AWS, both fine. The actual bug: I had simply never written the layers = [...] line inside aws_lambda_function in the first place. An empty layers list is valid Terraform — nothing about it looks wrong to plan, since a Lambda with zero layers is a legitimate configuration, just not the one I wanted.
aws lambda get-function-configuration --function-name ingestion_lambda_function --query "Layers"
returned null, which is what finally pointed me at the real problem.
A hardcoded engine version that didn't exist anymore
terraform apply on the RDS instance failed with:
InvalidParameterCombination: Cannot find version 16.4 for postgres
I'd picked that version from memory. RDS's supported version list changes over time, and the one thing plan/validate can't tell you is whether a specific value is still valid against the real service. Checking the current list before hardcoding anything version-related is now just part of my workflow:
aws rds describe-db-engine-versions --engine postgres --region eu-west-1 \
  --query "DBEngineVersions[].EngineVersion" --output table
The exclamation mark that broke bash
Secrets Manager ARNs for RDS auto-generated passwords look like rds!db-6cc4fd1e-.... That literal ! inside a double-quoted bash string gets interpreted as history expansion, and the whole command fails with event not found. Single quotes fixed it — a small thing, but the kind of thing that costs ten confused minutes the first time it happens.
Grafana defaulting to the wrong query format
The first panel I built in Grafana's Explore view showed "Data outside time range" and plotted track_id as if it were a numeric value instead of a series label. The query editor defaults to Table format, not Time series — under Table format, Grafana has no way to know which column is meant to be the time axis. Switching to Time series, aliasing the date column explicitly AS time, and casting track_id::text so it's treated as a label rather than a value, fixed it immediately.
It works
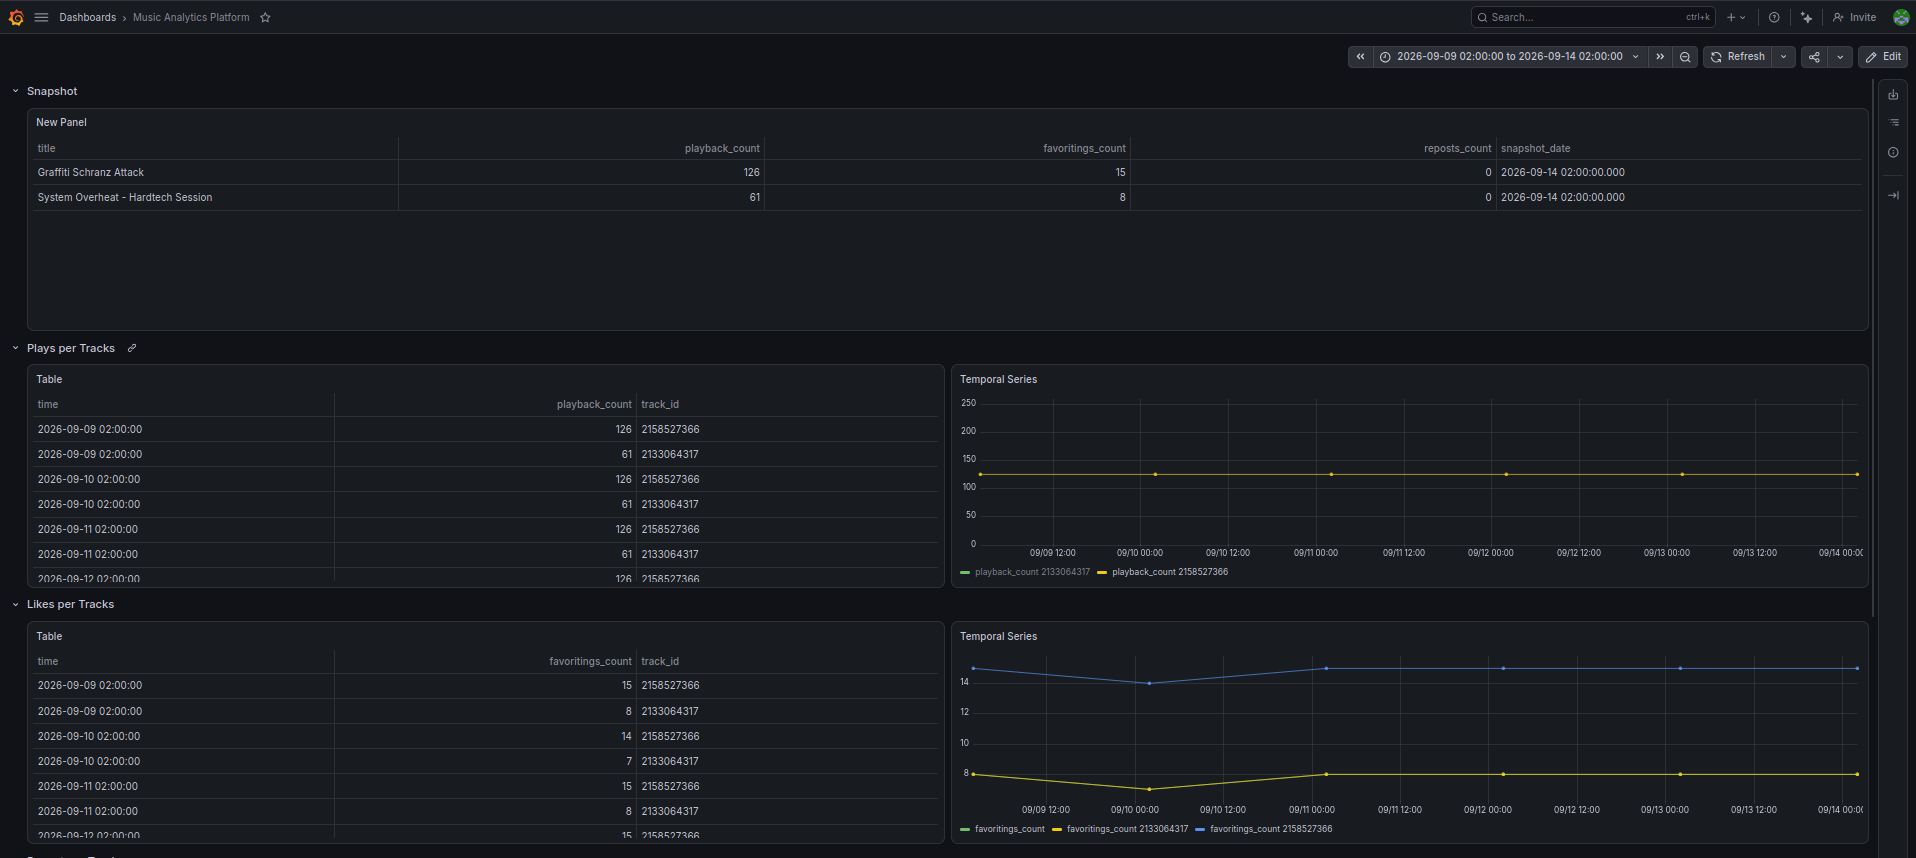
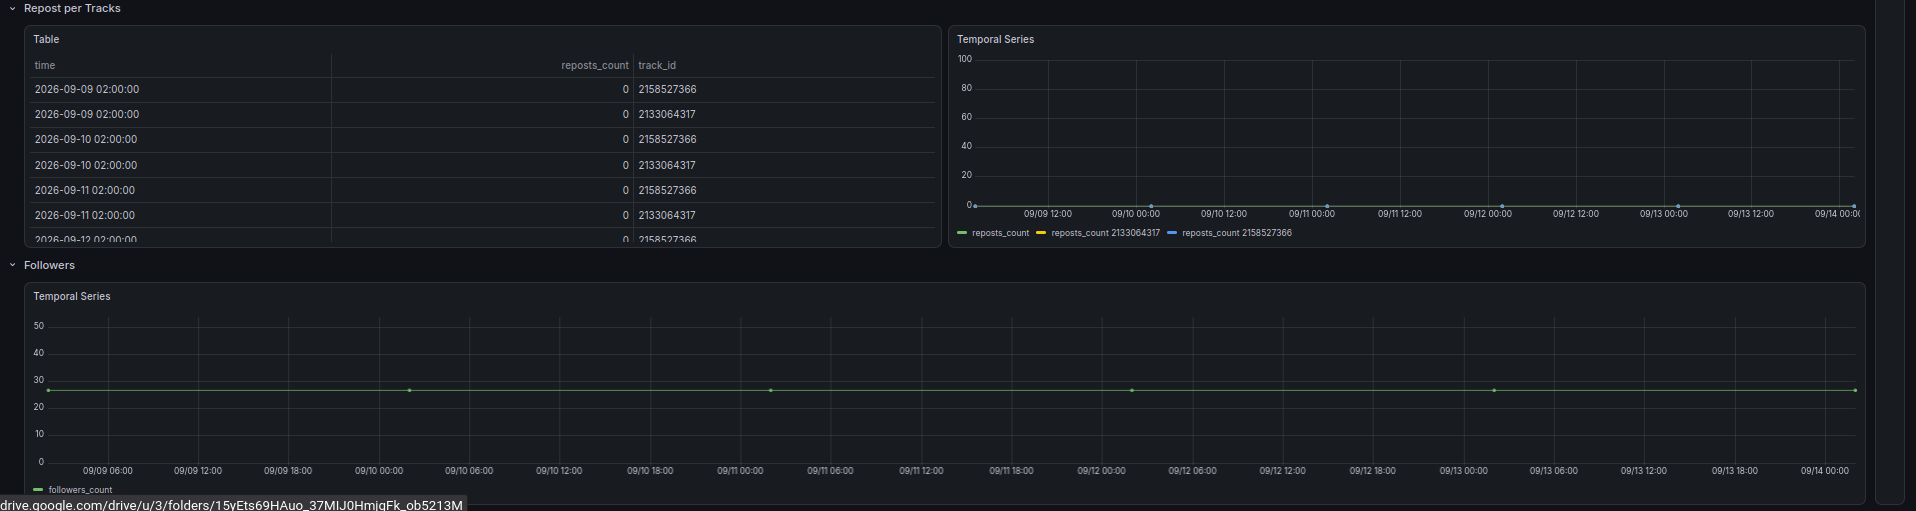
Once all of this was sorted out, the pipeline ran end to end without me touching anything: EventBridge fired the Lambda, it read my SoundCloud stats, wrote them to RDS, and Grafana picked them up. That's the payoff — a dashboard that updates itself every day, with data I actually look at.
Cost
I left the stack running for 5 days to get a few real data points and checked AWS Cost Explorer afterward, broken down by service:
| Service | Cost (5 days) |
|---|---|
RDS (db.t4g.micro) |
~$0.0000006 |
| Lambda | $0 |
| Secrets Manager | ~$0 |
| S3 / DynamoDB (Terraform backend) | $0 |
| EventBridge / CloudWatch | $0 |
| Total | $0.00 |
That's not an exaggeration — it rounds to zero. The costs were covered by the 12-month free tier on the new AWS account. Outside the free tier, the same 5 days would cost roughly **$1.92**, assuming an RDS price of about $0.016/hour.
This is still a low cost for short-term deployments, especially with the on-demand deploy and destroy strategy described in ADR 0006.
What this project demonstrates
Beyond the dashboard itself, the parts I'd point to in an interview are the ones this post covers: least-privilege IAM policies, credential management split deliberately between Parameter Store and Secrets Manager, remote Terraform state with locking, and — probably more valuable than any of that — a couple of real examples of architecture decisions that had to change once they met an actual AWS account instead of just the documentation.
None of this is complicated engineering on its own. What it forced me to practice was reading an error message, forming a hypothesis about what's actually wrong, and checking it — the same loop, regardless of whether it's a missing Terraform argument or a bash quoting quirk.
The full source, including the architecture decision records for every choice mentioned here (and a few more), is on GitHub.